
Charlotte Area Housing Market Update: September 2026
On paper, September looked like a slower month for the Charlotte area. Fewer homes sold, and buyers toured fewer homes. But I have to be honest. It sure didn’t feel slow to me!
This month, I helped a seller close on their home, and I helped a buyer purchase a home in Monroe. In between, there were band competitions, networking meetings, and open houses. I also talked with a lot of buyers and homeowners about the market, what I’m seeing, and how they are feeling. So yes, it was a busy month.
Here is what the numbers show, what I’m seeing on the ground, and what it all means for you.
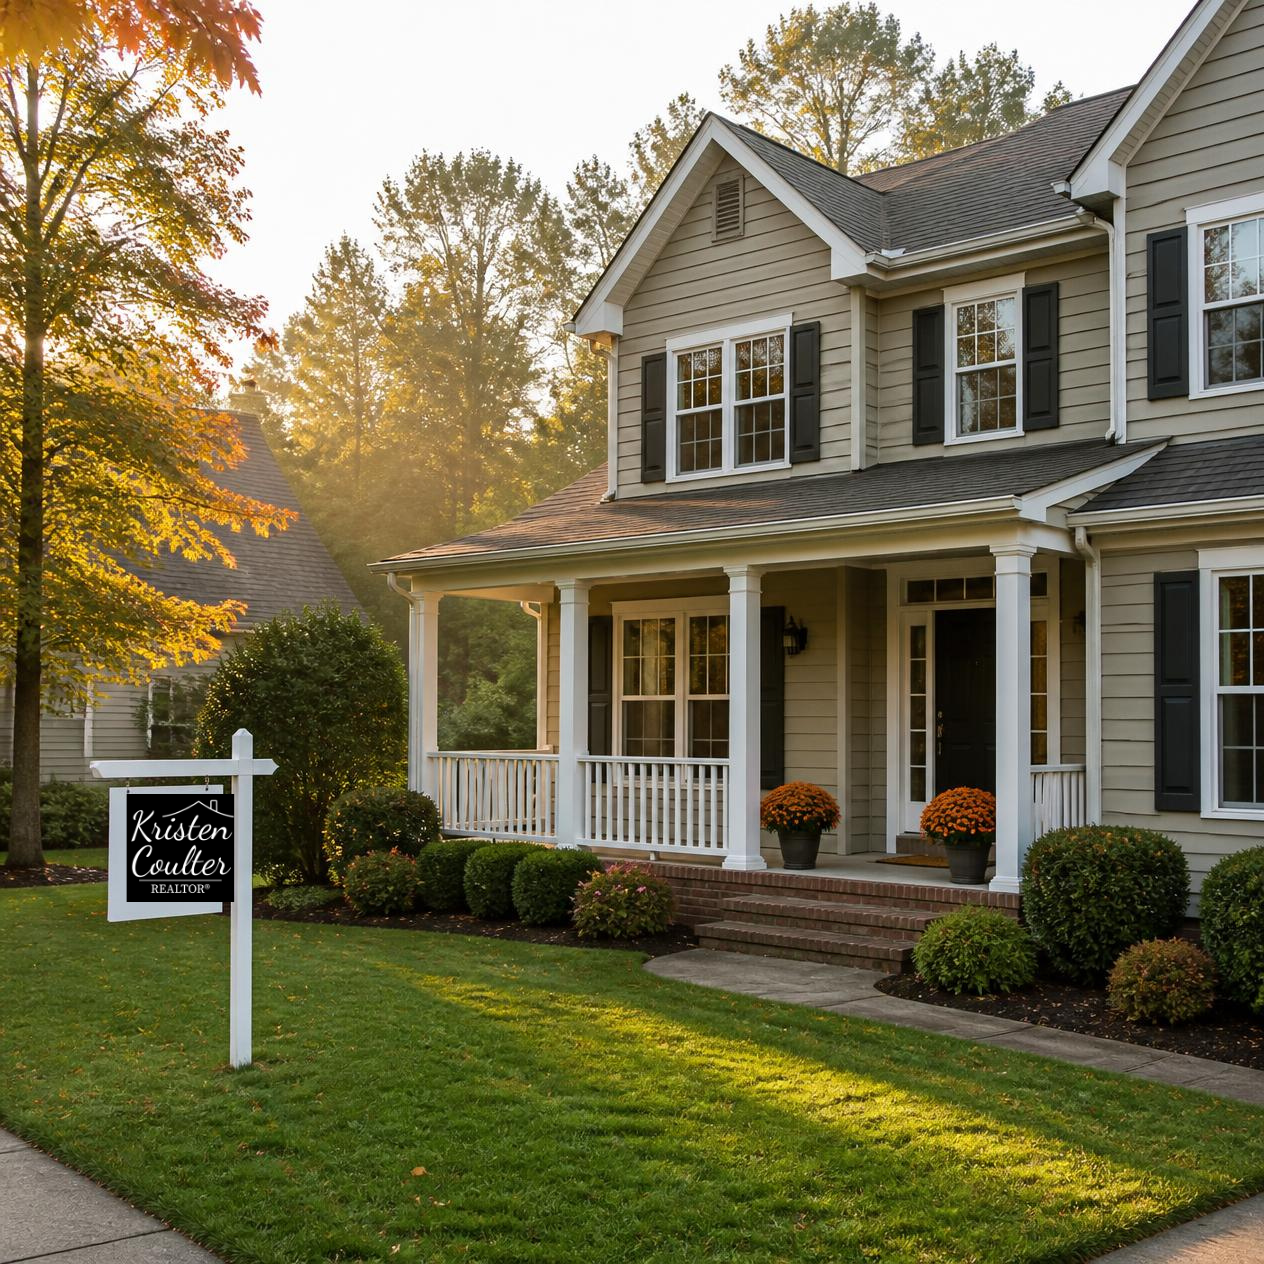
THE BIG PICTURE: HOME SALES ACROSS THE CHARLOTTE REGION
These numbers come from Canopy MLS. They cover the 16-county Charlotte Region, which includes Union, Mecklenburg, York, and Lancaster counties, plus other nearby counties.
Prices held steady. The median sales price was $392,990. The median is the middle price when you line up every sale from lowest to highest. Half sold for more, and half sold for less. That is down just 0.5% from last September. So far this year, the median is $400,000, almost exactly the same as 2025.
Fewer homes sold. A total of 3,439 homes closed in September, which means they finished the sale process. That is 10.1% fewer than a year ago.
More homes are for sale. At the end of September, 13,558 homes were listed and available to buy. That is 5.7% more than last year.
Homes are taking a little longer. On average, homes spent 54 days on the market before going under contract. On average, sellers got 95.1% of their original asking price.
The market is balanced. Months of supply rose to 3.8, up from 3.5 a year ago. Months of supply tells us how long it would take to sell every home on the market if no new homes were listed. Between 3 and 6 months is fairly balanced. At 3.8, we are balanced and leaning a little more toward buyers than last year.
Rates played a big part. The Federal Reserve raised its benchmark rate on September 16, and 30-year mortgage rates moved above 7% late in the month, according to Freddie Mac.
WHAT I’M SEEING ON THE GROUND
The numbers are only part of the story. I also look closely at the homes that are still on the market and the ones that expired without selling. They tell a story, too.
Price it right from the start. I see more price reductions the longer a home stays on the market. In my own neighborhood, homes that were priced right from the start went under contract in about two weeks on average. That is a small number of homes, but the pattern is clear. It is also much faster than the 54-day average across the region.
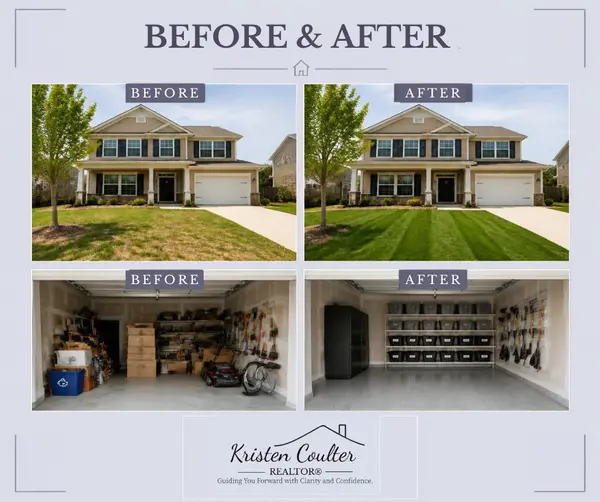
Presentation matters. Getting your house ready for the next owner is so important. You know the saying: you only get one chance to make a good first impression. That is true for homes, too.
UNION COUNTY
Union County was the bright spot this month. Showings, which are the home tours buyers book, stayed flat from last year, up 0.2%. Most of the metro dropped. Buyer interest is the average number of showings each listing gets. In Union County, it rose 2.8% to 3.7 showings per listing, tied for the highest of any county in the Charlotte metro.
- Monroe: 1,152 showings, up 14.5% from last year. Buyer interest rose 20.0% to 3.6 showings per listing. That lines up with what I saw firsthand helping my buyer purchase there this month.
- Waxhaw: 1,160 showings, up 8.5%. Buyer interest was 3.6 showings per listing, up 2.9%. Most of the activity was in homes priced at $429,000 and up.
Rentals: The average rent in Union County was $2,315 a month over the past year, the highest among metro counties. The number of homes leased rose 5.8%.
MECKLENBURG COUNTY
Mecklenburg County felt the slowdown more. Buyers booked 17,878 showings, down 18.0% from last year. Buyer interest was 3.3 showings per listing, down 19.5%.
- City of Charlotte: 14,690 showings, down 16.2%. Buyer interest was 3.3 showings per listing.
- Matthews: 1,123 showings, down 26.8%. But buyer interest was 4.5 showings per listing, the highest of any area in this month’s report. Fewer homes are for sale there, so each one is getting more attention.
Rentals: The average rent in Mecklenburg County was $2,213 a month over the past year, up 0.9%.
YORK COUNTY, SC
York County had the biggest drop in showings among the counties I cover. Buyers booked 4,012 showings, down 21.0%. Buyer interest was 3.0 showings per listing, down 14.3%.
- Fort Mill: 1,468 showings, down 15.8%. Buyer interest was 3.1 showings per listing.
- Rock Hill: 1,441 showings, down 29.9%. Buyer interest was 3.2 showings per listing.
- Lake Wylie: 1,191 showings, down 14.7%. Buyer interest was 2.9 showings per listing.
Rentals: The average rent in York County was $2,262 a month over the past year, down 0.9%.
LANCASTER COUNTY, SC
Lancaster County held up well. Buyers booked 1,749 showings, down just 1.1% from last year. Buyer interest was 2.8 showings per listing, down 6.7%.
Rentals: The average rent in Lancaster County was $2,213 a month over the past year, down 3.6%.
WHAT THIS MEANS FOR YOU
For buyers: I can’t tell you how many times I have said you have more choices. And it is your choice whether to wait or to shop now. But here’s the thing. Waiting could cost you. If many buyers are waiting for rates to drop, we could see a lot more competition when they do. That means you may end up paying more for a home than you would today, while sellers are willing to negotiate.
For sellers: You can’t list for a dream price. You have to list based on the market data. Your home also needs to be ready from day one. Take care of that deferred maintenance, which means the repairs that have been put off over the years. Do a deep clean on the home you have lived in for years. And show buyers what they can do in the home, not how you live in the home.
Above all, make the most informed decision you can for your situation. That means talking with me to get the facts on the market and the area you are interested in. It also means talking with a lender to understand what a purchase means for you financially. Just looking at houses is not a plan. It is a dream. Make that dream a reality by talking with the professionals first. You can be a homeowner. You just have to get all the facts.
FREQUENTLY ASKED QUESTIONS
Are home prices going down in Charlotte?
Not really. The median sales price across the Charlotte Region was $392,990 in September 2026, down just 0.5% from a year ago. So far this year, the median price is $400,000, almost exactly the same as 2025. Prices are holding steady even as sales slow. What I am seeing is that homes priced right from the start sell faster and need fewer price cuts.
Is Charlotte a buyer’s or seller’s market right now?
Charlotte is a balanced market that is leaning slightly toward buyers. Months of supply reached 3.8 in September 2026, up from 3.5 a year ago. Sellers got 95.1% of their original asking price on average. Buyers have more room to negotiate, but areas like Monroe and Matthews are still getting strong buyer interest, so good homes can still move quickly.
Should I wait for mortgage rates to drop before buying?
It depends on your situation, but waiting has its own costs. Rates moved above 7% in late September 2026, and many buyers are sitting on the sidelines. When rates drop, those buyers may come back at the same time, which could mean more competition and higher prices. Talk with a lender and a local agent to see what makes sense for you.
How much is rent in Union, Mecklenburg, York, and Lancaster counties?
Over the 12 months ending September 2026, average monthly rent was $2,315 in Union County, $2,213 in Mecklenburg County, $2,262 in York County, and $2,213 in Lancaster County. Union County had the highest average rent among Charlotte metro counties, and the number of homes leased there rose 5.8% from the year before.
Sources:
- Canopy MLS, Inc. Charlotte Region Monthly Indicators, September 2026. Data deemed reliable but not guaranteed.
- ShowingTime Showing Statistics, Charlotte Region, provided by the Canopy Realtor® Association, September 2026.
- Canopy Realtor® Association, Charlotte Region Rental Report, September 2026.
- Federal Reserve and mortgage rate information from NAR and Freddie Mac, as reported by the Canopy Realtor® Association.
- All data current as of October 5, 2026.
- Neighborhood observations are based on Kristen Coulter’s review of local listings and are not an official MLS statistic.
Thinking About Buying or Selling in the Charlotte Area?
Whether you are looking in North Carolina or South Carolina, I would love to be your guide. Reach out anytime.
Kristen Coulter, REALTOR® | Licensed in NC and SC
Real Broker, LLC | 704-850-9870 | www.KristenCoulter.com | Realtor@KristenCoulter.com
Categories
Recent Posts




Agent North Carolina DRE# 356014South Carolina DRE# 141161
+1(704) 221-1276 | realtor@kristencoulter.com